

Yektanet Says Social Media Leads Iran’s Digital Ad Market
Social media took 31% of Iran’s digital ad market, Yektanet estimates, while war and internet shutdowns disrupted advertising budgets, content creators and daily online activity.

Latest from Interview


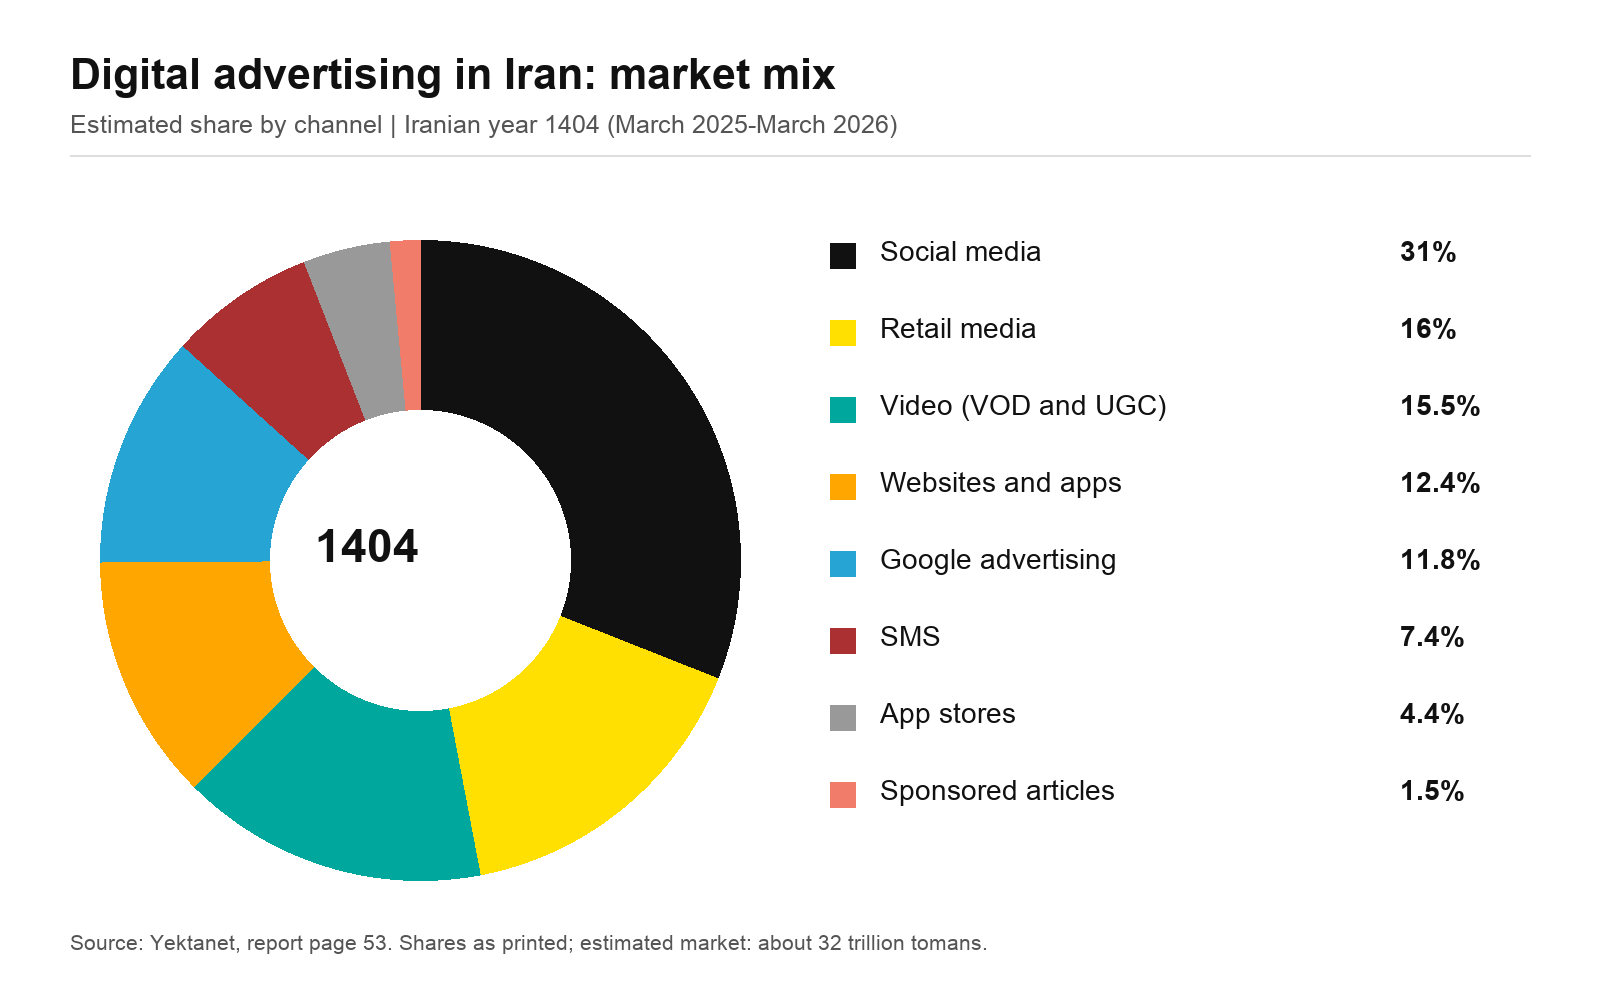
Social media was the largest segment of Iran’s digital advertising market in the Iranian year ending in March 2026, accounting for 31% of spending in a market worth about 32 trillion tomans, according to a new annual report from advertising platform Yektanet.
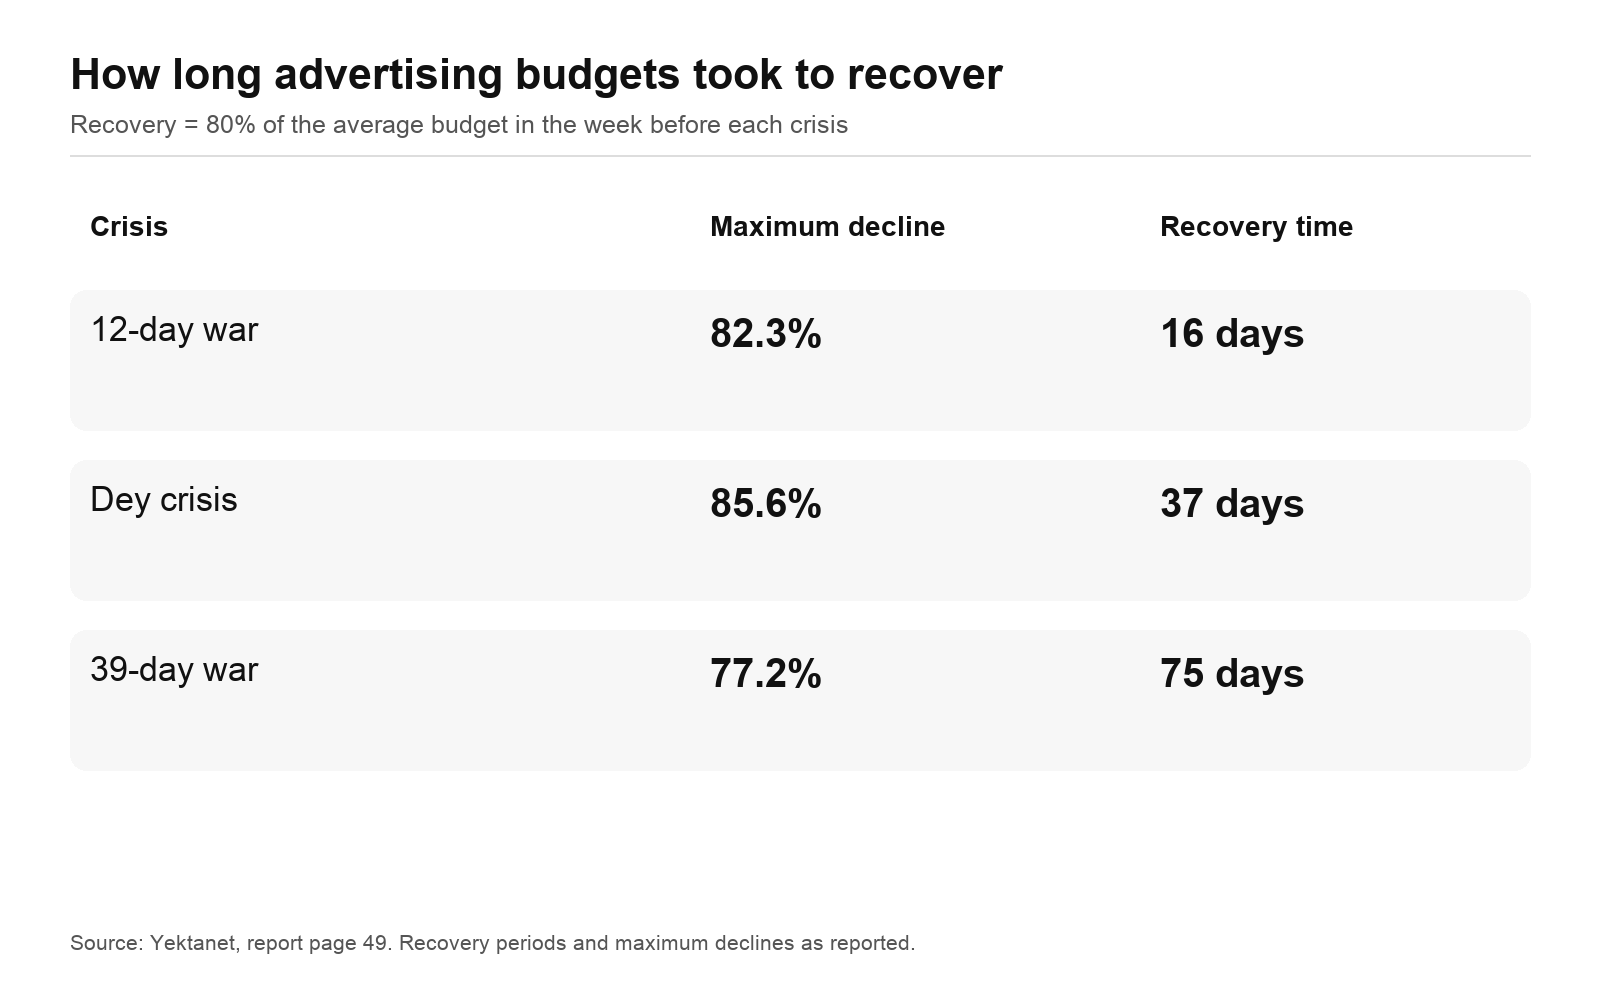
The report puts social advertising spending at around 10 trillion tomans. But it also shows how quickly war and internet shutdowns can interrupt the flow of money: budgets took 75 days to recover to a specified threshold after the period it describes as the 39-day war, compared with 16 days after the 12-day war.
Yektanet’s report on digital marketing in Iran covers Iranian year 1404, roughly March 2025 to March 2026, and developments in spring 1405. It combines advertising data with research into online behavior and figures from other companies on mobile use and Persian-language content.
Social media leads a growing market
Yektanet estimates the market at 32.2 trillion tomans, up from about 11 trillion tomans in Iranian year 1402, roughly March 2023 to March 2024. These are spending figures in local currency; the increase does not by itself establish growth after inflation.
Retail media, meaning advertising on retailers’ platforms, accounted for 16% of the market. Video advertising on video-on-demand and user-generated-content platforms followed at 15.5%, while websites and apps accounted for 12.4%.
Google advertising made up 11.8%, SMS 7.4%, app-store advertising 4.4% and sponsored articles 1.5%, according to the report’s breakdown.
Advertising spending grows, then falls sharply
The number of active advertisers on Yektanet rose between 7% and 47% year on year in nine of the year’s 12 months. A pronounced fall came in Esfand, the final Iranian month, although its active-advertiser count remained above the levels in Farvardin and Tir earlier that year.
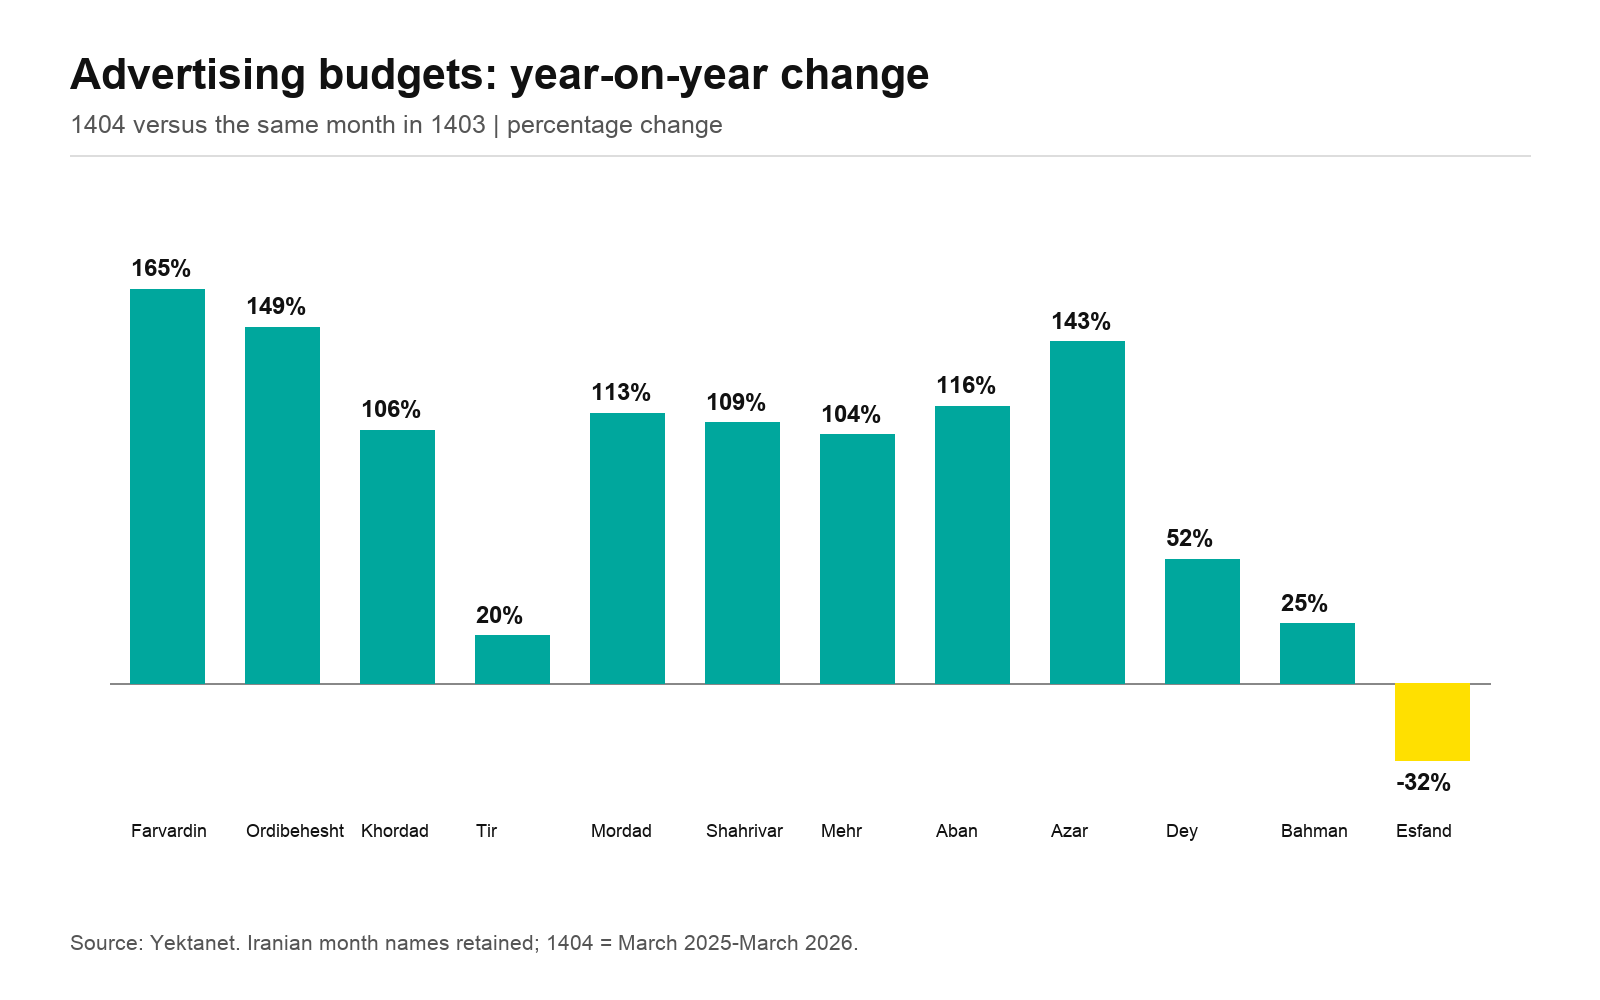
Advertising budgets increased year on year in 11 months, with triple-digit growth in eight. Esfand was the exception: spending fell 32% from the same month a year earlier.
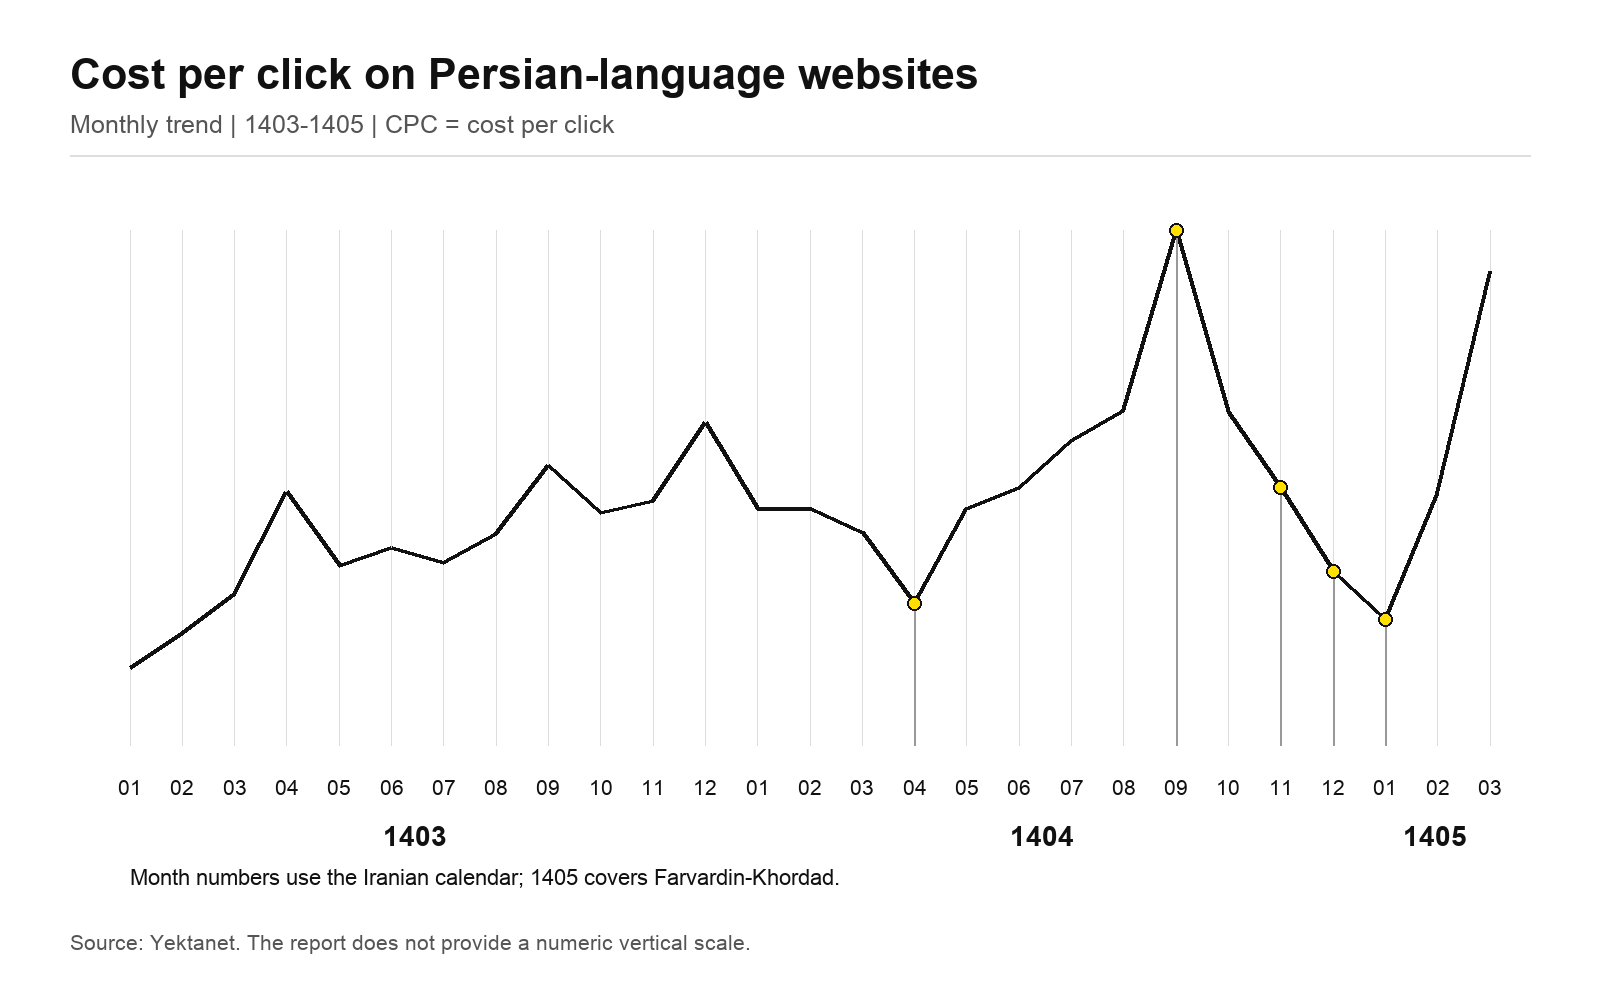
Monthly display-ad clicks on Persian-language websites reached their highest level in the two-year study period around Black Friday in Azar 1404. They then fell sharply with the 39-day war and internet shutdown in Esfand, reaching their lowest level in Farvardin 1405, roughly March–April 2026.
Cost per click, or CPC, also reflected the disruptions. Yektanet says average CPC fell 46% during the 12-day war. It subsequently recovered and peaked around Black Friday.
Apps and games showed a different pattern. Daily ad views increased significantly during all three crisis periods examined. The report attributes this to users turning to apps and games for entertainment when access to social networks and parts of the internet was restricted.
Recovery takes longer after extended disruption
Yektanet defines recovery as advertising budgets returning to 80% of their average in the week before a crisis began. By that measure, recovery took 16 days after the 12-day war, 37 days after the Dey crisis and 75 days after the 39-day war. The report identifies the Dey period as protests in that Iranian month, roughly December 2025–January 2026.
The maximum budget declines in those three periods were 82.3%, 85.6% and 77.2%, respectively. The recovery figures therefore describe a return to a defined spending threshold, rather than a complete return to pre-crisis activity.
Industries responded differently. Home appliances, health and medicine, cosmetics and personal-care stores, and grocery products were among those with the largest advertising-budget cuts during the war. Online insurance recorded the strongest spending growth. Online insurance, groceries, and telecommunications and internet services also recovered their budgets fastest afterward.
Four hours online, with different habits by generation
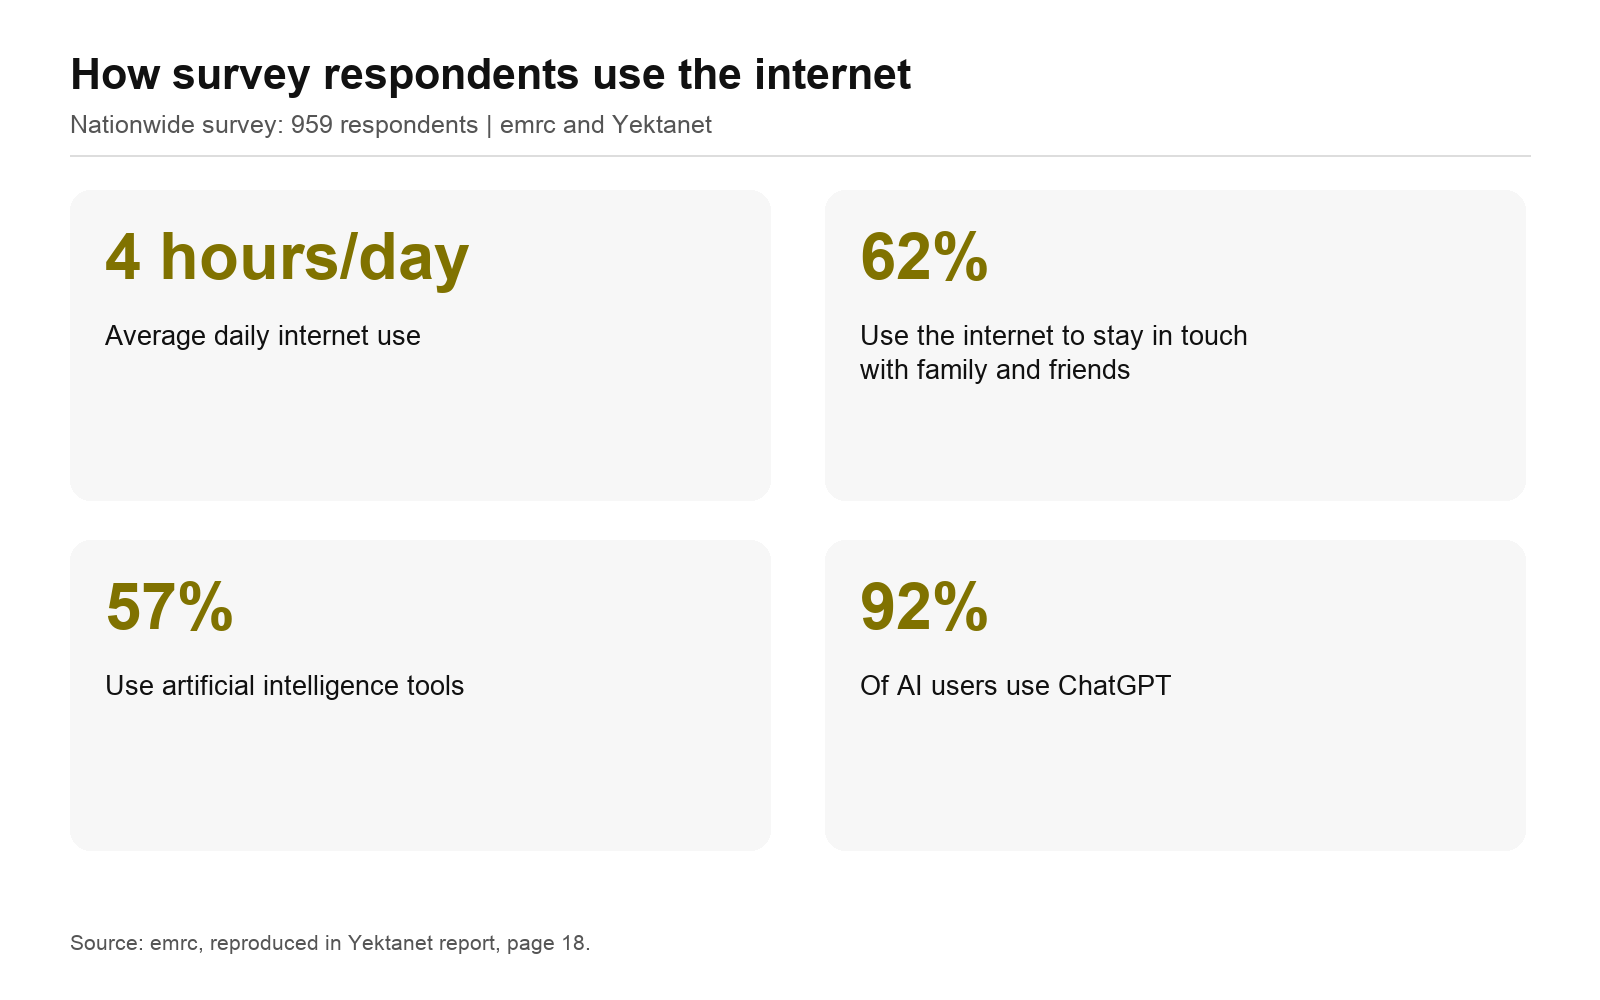
A nationwide survey of 959 people, conducted with market-research company emrc, found average daily internet use of four hours. More than one-third of Generation Z respondents spent over four hours online each day, while more than one-third of Generation X spent less than two hours.
The study defines Generation Z as ages 14–27, Generation Y as 28–45 and Generation X as 46–65. Younger respondents were more likely to use the internet for films, series, music and entertainment. Generation X more often used it to contact family and friends, follow news and access banking services. Generation Y led in online shopping.
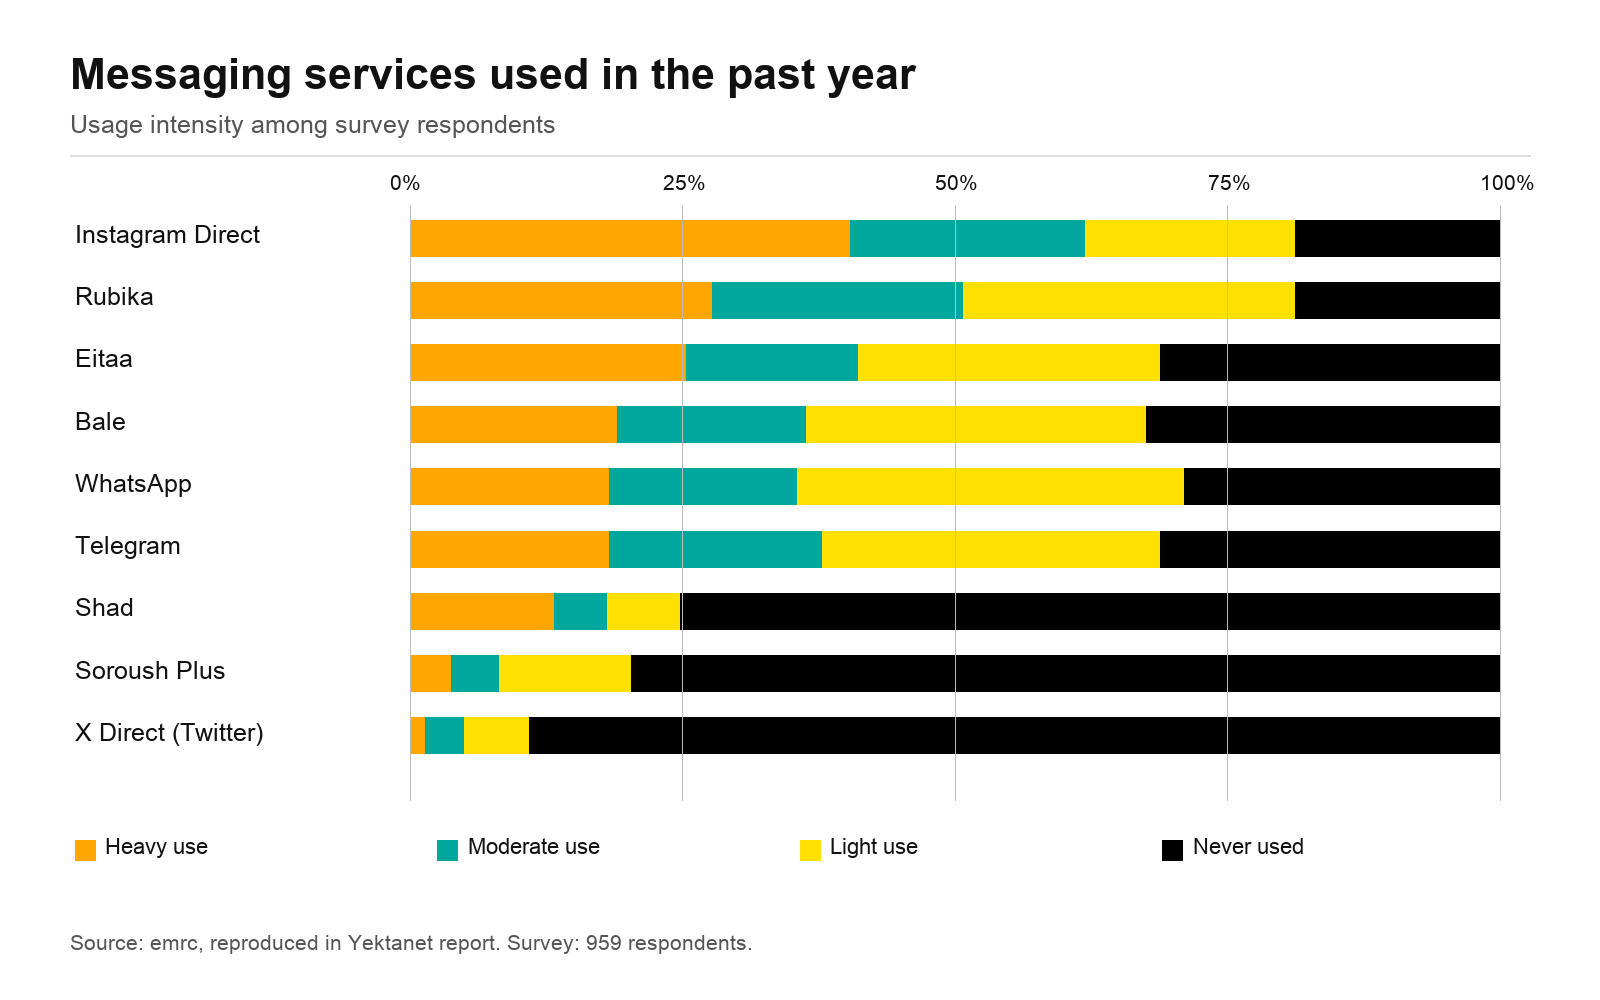
Instagram Direct led messaging use in the survey. The report also names Rubika, WhatsApp and Telegram as leading messaging services. Messaging services were the leading route to news, ahead of friends and acquaintances and news websites. Almost half of respondents said checking social networks or messaging services was their first activity after waking.
Among advertising channels covered by the survey, outdoor advertising had the highest reported exposure at 96%, followed by in-store advertising at 92% and SMS at 91%. Exposure measures whether people encounter an advertisement; it does not establish which channel generates the most purchases.
AI use is widespread in the survey
The survey found that 57% of respondents used AI tools. Only 26% of Generation Z said they had never used them, and more than one-third reported daily use. About half of Generation X and 42% of Generation Y said they did not use such tools.
Finding information and learning were the leading uses across all three generations. Generation X and Y leaned more toward practical and professional applications, while Generation Z’s use was more varied and personal.
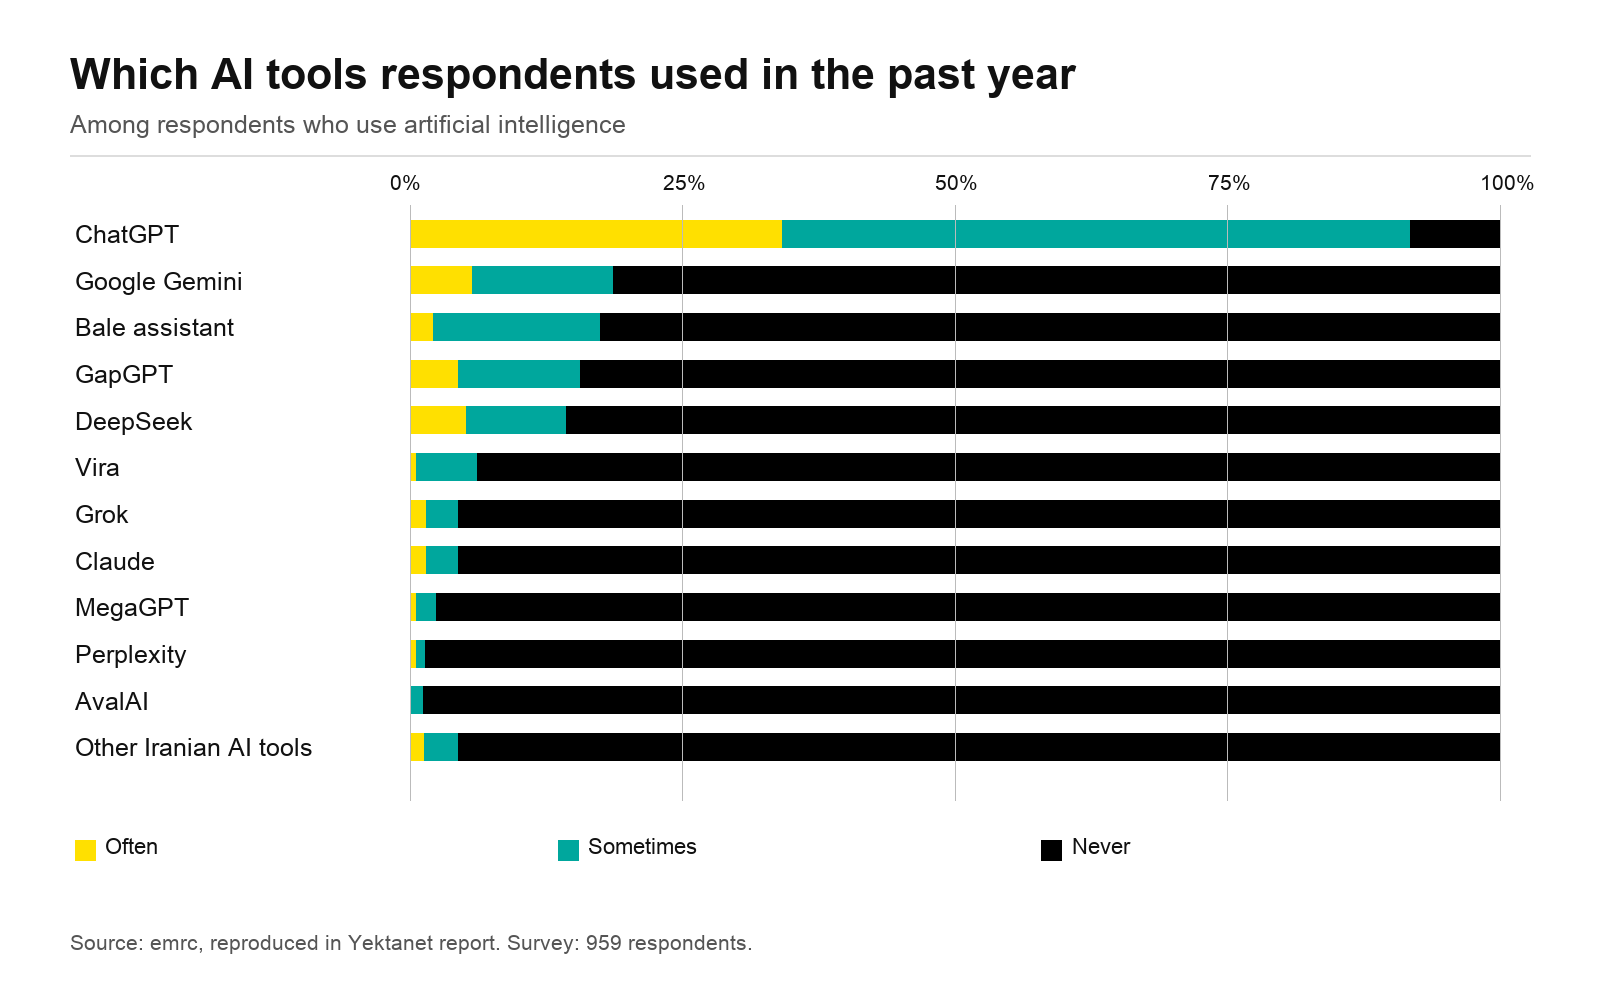
Among respondents who used AI, 92% said they used ChatGPT at least sometimes, well ahead of Google Gemini at 19% and the assistant offered by Iranian messaging service Bale at 17%.
Persian-language creators face a gap between output and audience
Data from social-media analytics company Zelkaa, included in the report, puts the number of posts on public Iranian Instagram pages at more than 630 million during 1404. Advertising revenue for popular Iranian pages and influencers exceeded an estimated 10 trillion tomans. The report also counts more than 89,000 shops on domestic messaging and social platforms.
Public Persian-language Telegram channels published more than one billion posts. But monthly output fell from 132 million in Bahman to 13 million in Esfand. Instagram posts fell from 88 million to 19 million over the same interval.
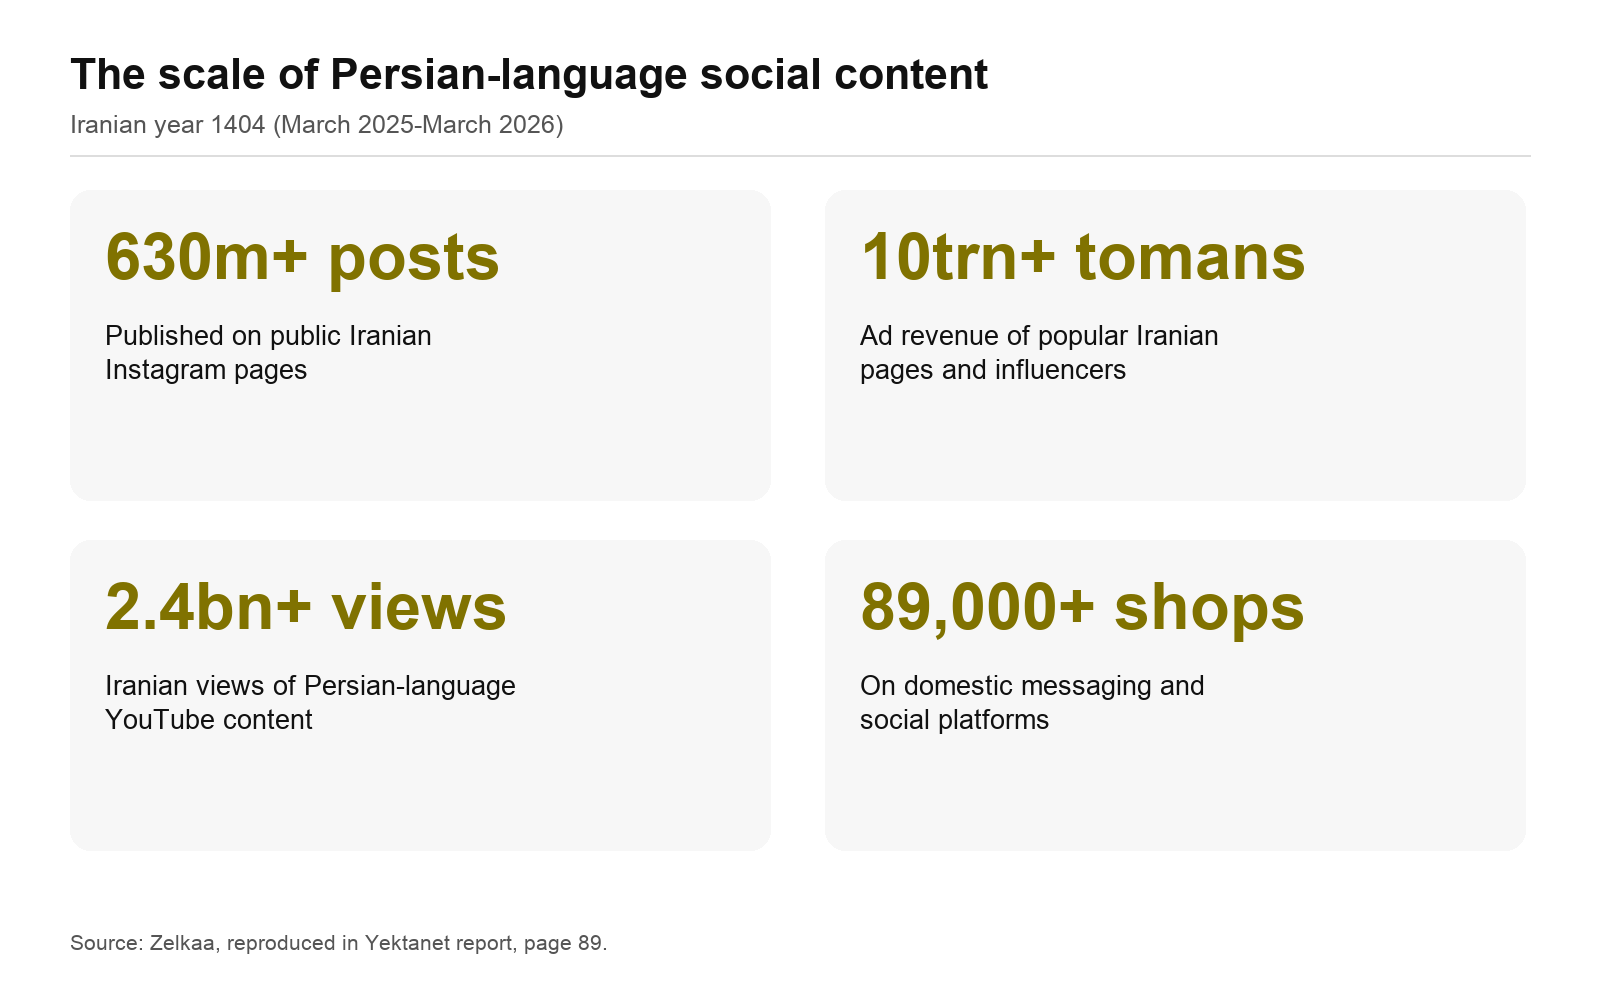
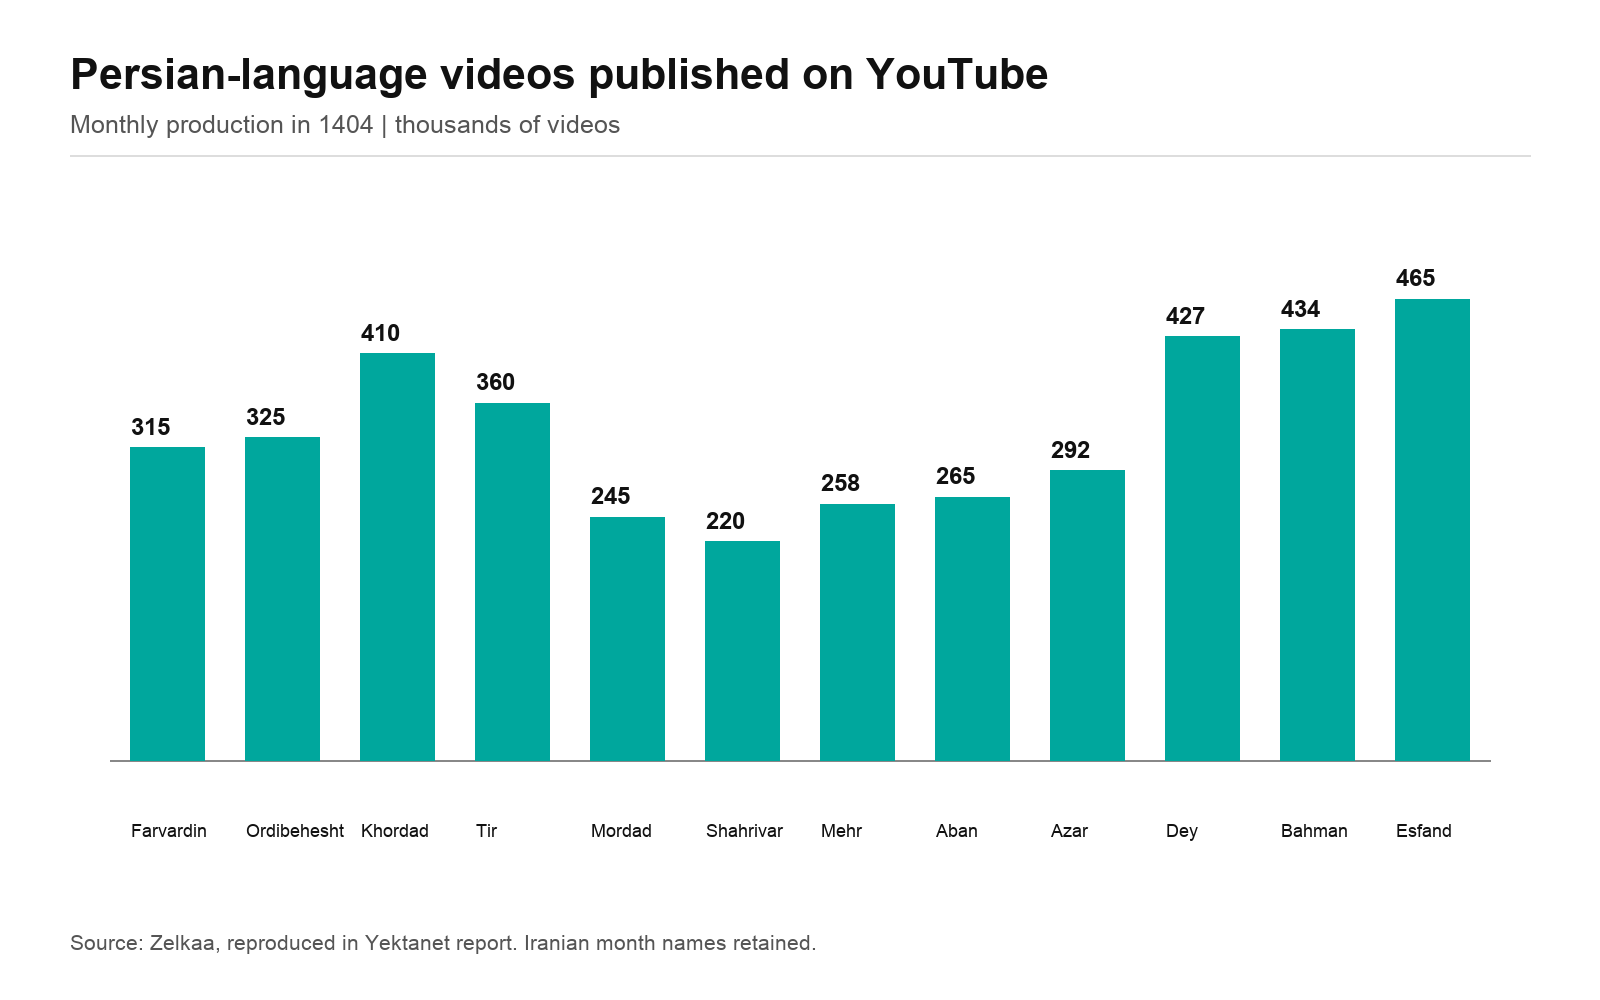
Persian-language YouTube content totaled more than four million videos and around 2.44 billion views during the year. Uploads reached about 465,000 in Esfand, even as views fell to roughly 58 million, compared with a monthly peak of around 250 million in Tir.
The divergence shows that higher output need not translate into higher viewing during access disruptions. The figures do not establish where the videos were produced or how much of the output came from creators outside Iran.
Lifestyle and comedy feature heavily among top earners
Lifestyle, comedy, and mother-and-child accounts together represented 51% of the 500 highest-earning Instagram pages in the report. Audience-growth figures compiled by influencer-marketing company Jaryan show substantial gains for individual accounts.
Among business pages, parvaz_capital added around 1.4 million followers to reach 3.7 million, while mobl_nilofar added 1.3 million to reach 2.1 million. Among nonbusiness pages, tarikhmodern added 1.2 million to reach 5.1 million. Football 360 and Hashiyeh added around 834,000 and 793,000, respectively.
Among the influencers listed, Amirhossein Ghiasi, Bahram Farhadi and Milad Taster recorded the largest follower gains, adding 3.2 million, 2.8 million and 2.6 million, respectively.
Finance and gold drive website advertising
More than 10,000 Iranian websites carried advertisements in 1404, recording a combined 562 billion ad impressions. Page views on Persian-language websites nevertheless fell by more than 25% compared with 1403.
Music had the largest share in the report’s publisher-category breakdown at 14.8%, followed by finance and investment at 10.9% and technology at 9.9%. Finance and investment gained nine percentage points in its share of views from a year earlier.
On the advertiser side, finance, fintech and insurance attracted the largest share of website advertising budgets. Gold, silver and jewelry followed, then home and office appliances. Together, these three groups accounted for around half of website ad spending.
Gold, silver and jewelry advertising budgets tripled from 1403, while messaging services’ advertising budgets rose 118%.
Mobile dominates access
Mobile data compiled with Iranian app stores Myket and SibApp and attribution provider Adtrace shows that phones accounted for 94.5% of web use, leaving 5.5% for personal computers. Computer use peaked at 11 a.m., during working hours.
The number of iOS users rose about 12.5% from 1403. New Iranian Android app releases fell 46%, to more than 9,000. Among app users, 75% connected through mobile internet and 25% through Wi-Fi. Samsung accounted for 50% of the phone-brand breakdown and Xiaomi for 36%.
The wider advertising context
The report’s international overview puts total global advertising spending in 2025 above $1 trillion, with roughly two-thirds going to digital channels and total spending up 8.4% from 2024. It draws on Dentsu and Zenith for the shift toward digital, while television remains the main nondigital channel.
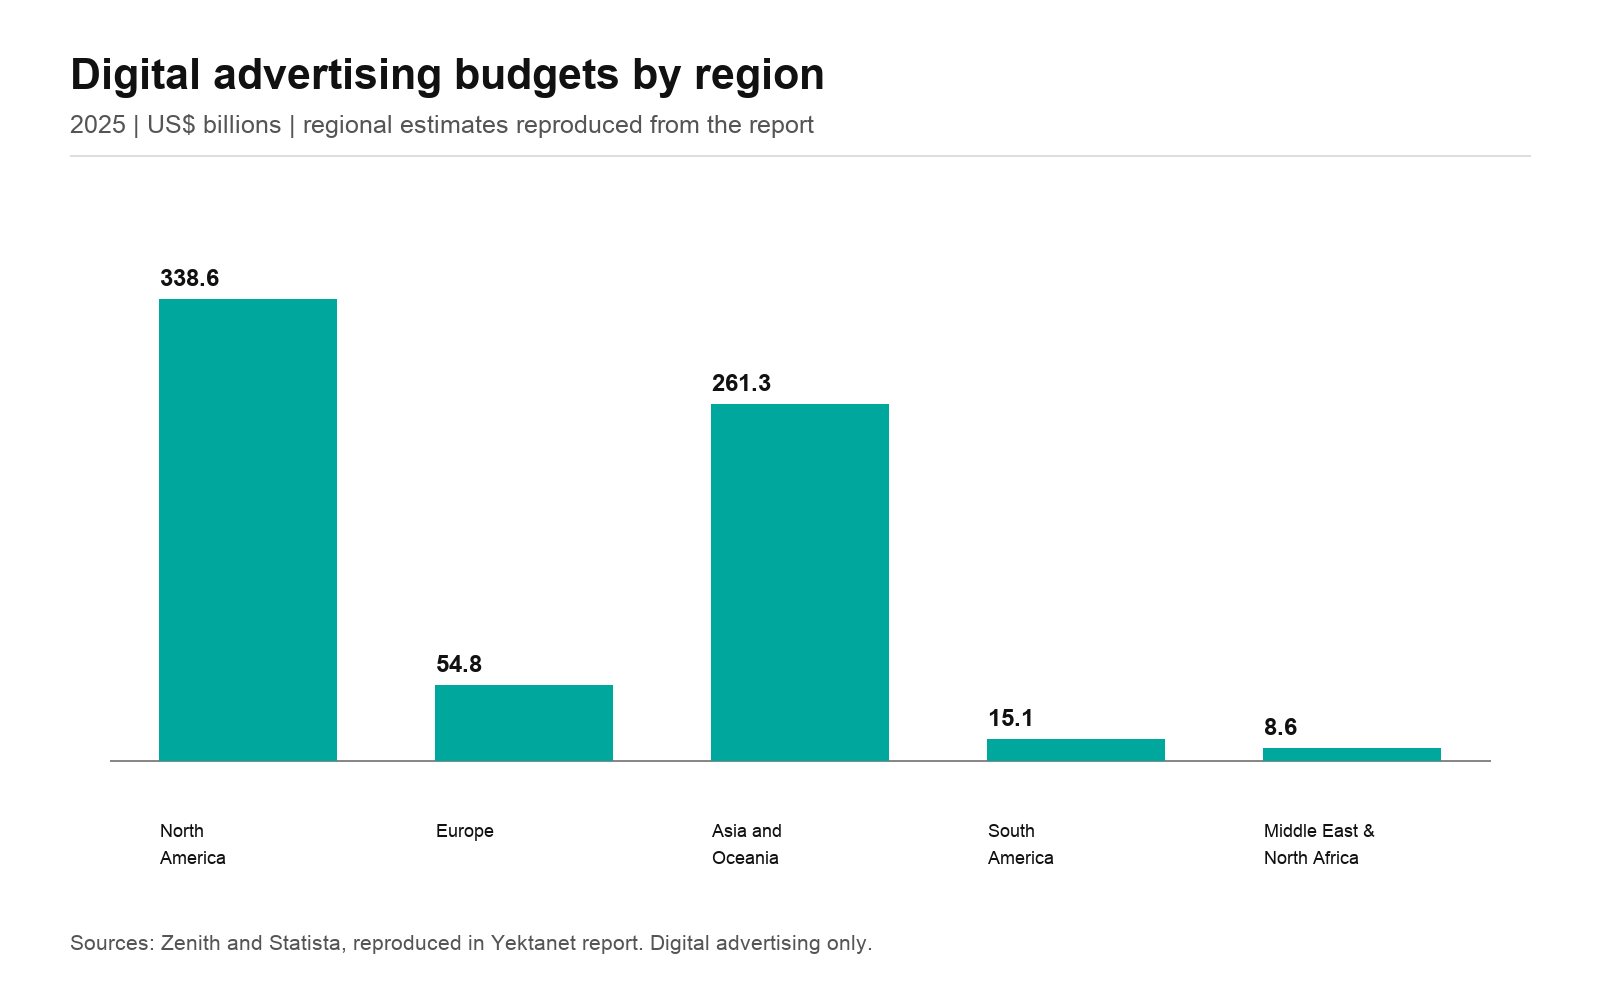
Regional digital-advertising estimates reproduced from Zenith and Statista put spending in the Middle East and North Africa at $8.6 billion in 2025. This is a digital-advertising figure, rather than the region’s total advertising market. In South and Southwest Asia, the report says traditional channels still accounted for close to three-quarters of advertising budgets.
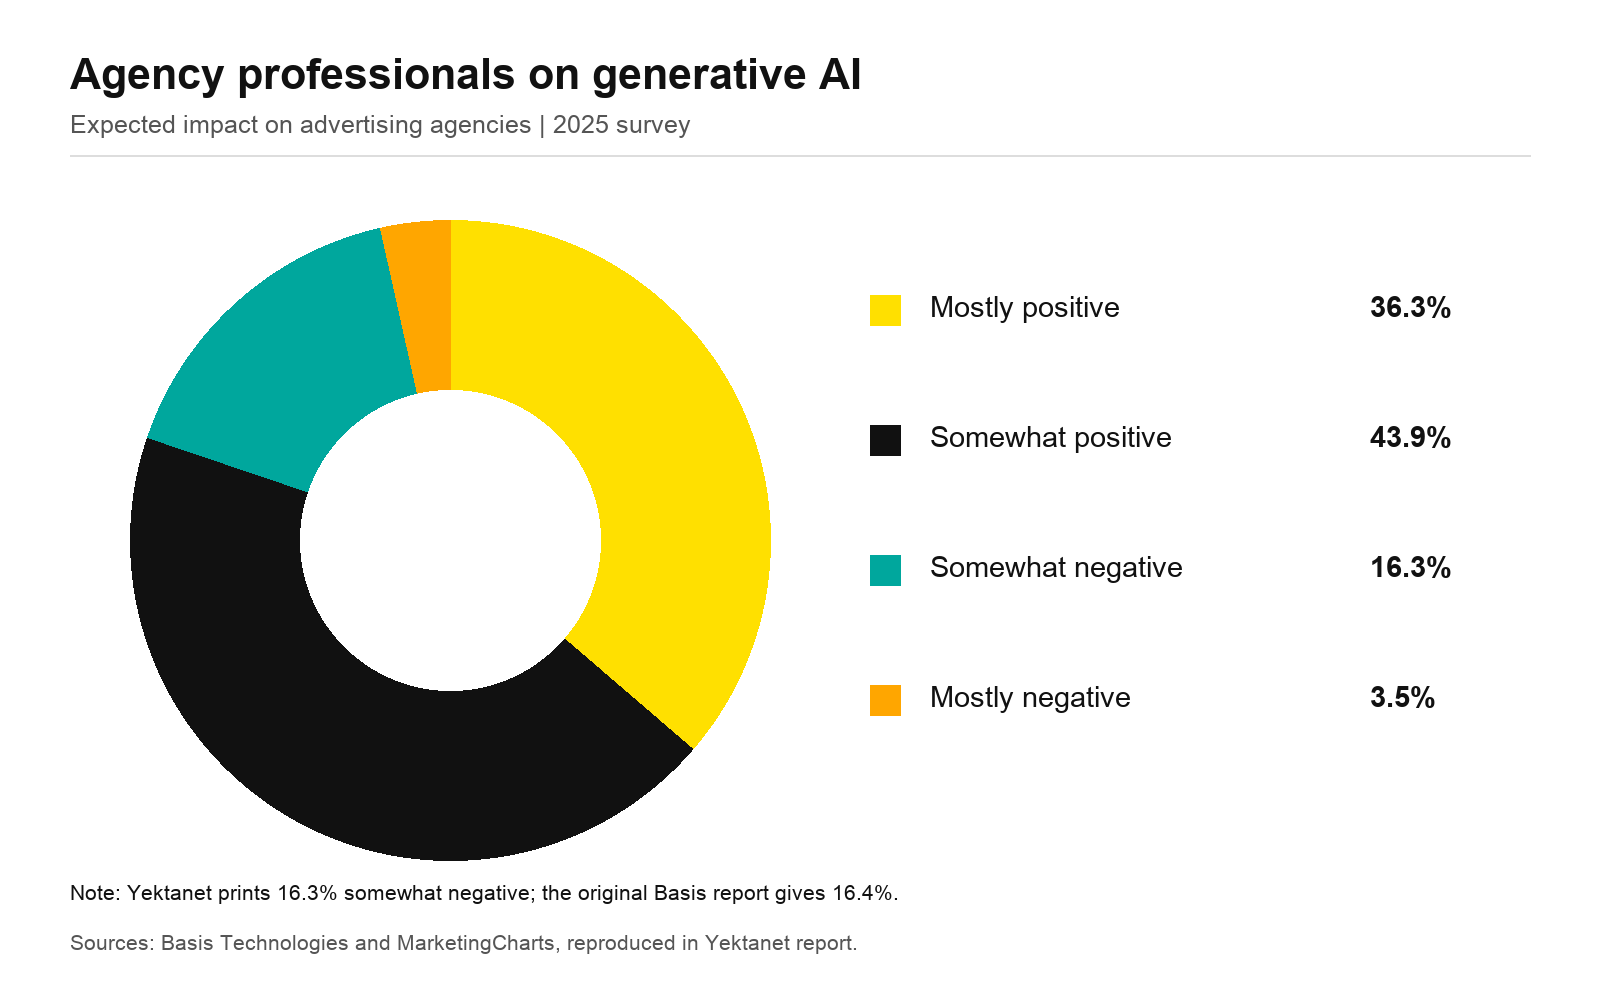
The international section also cites a 2025 survey of advertising agency professionals from Basis Technologies, reported by MarketingCharts. Some 36.3% expected generative AI’s impact on agencies to be mostly positive and 43.9% somewhat positive, a combined 80.2%. The figures refer to the overall respondent group, rather than only senior decision-makers. Basis Technologies’ original survey records 171 respondents for this question.