


Computing Tops Second Choices for Dissatisfied Graduates in Iran
Jobvision finds computing and IT top dissatisfied graduates’ alternative choices in Iran, while employment, related work and income are linked to satisfaction with educational choices.

Latest from Interview


Computing and information technology are the leading subjects dissatisfied graduates in Iran would choose if they could restart their university education, according to a new report by Jobvision, an Iranian recruitment platform.
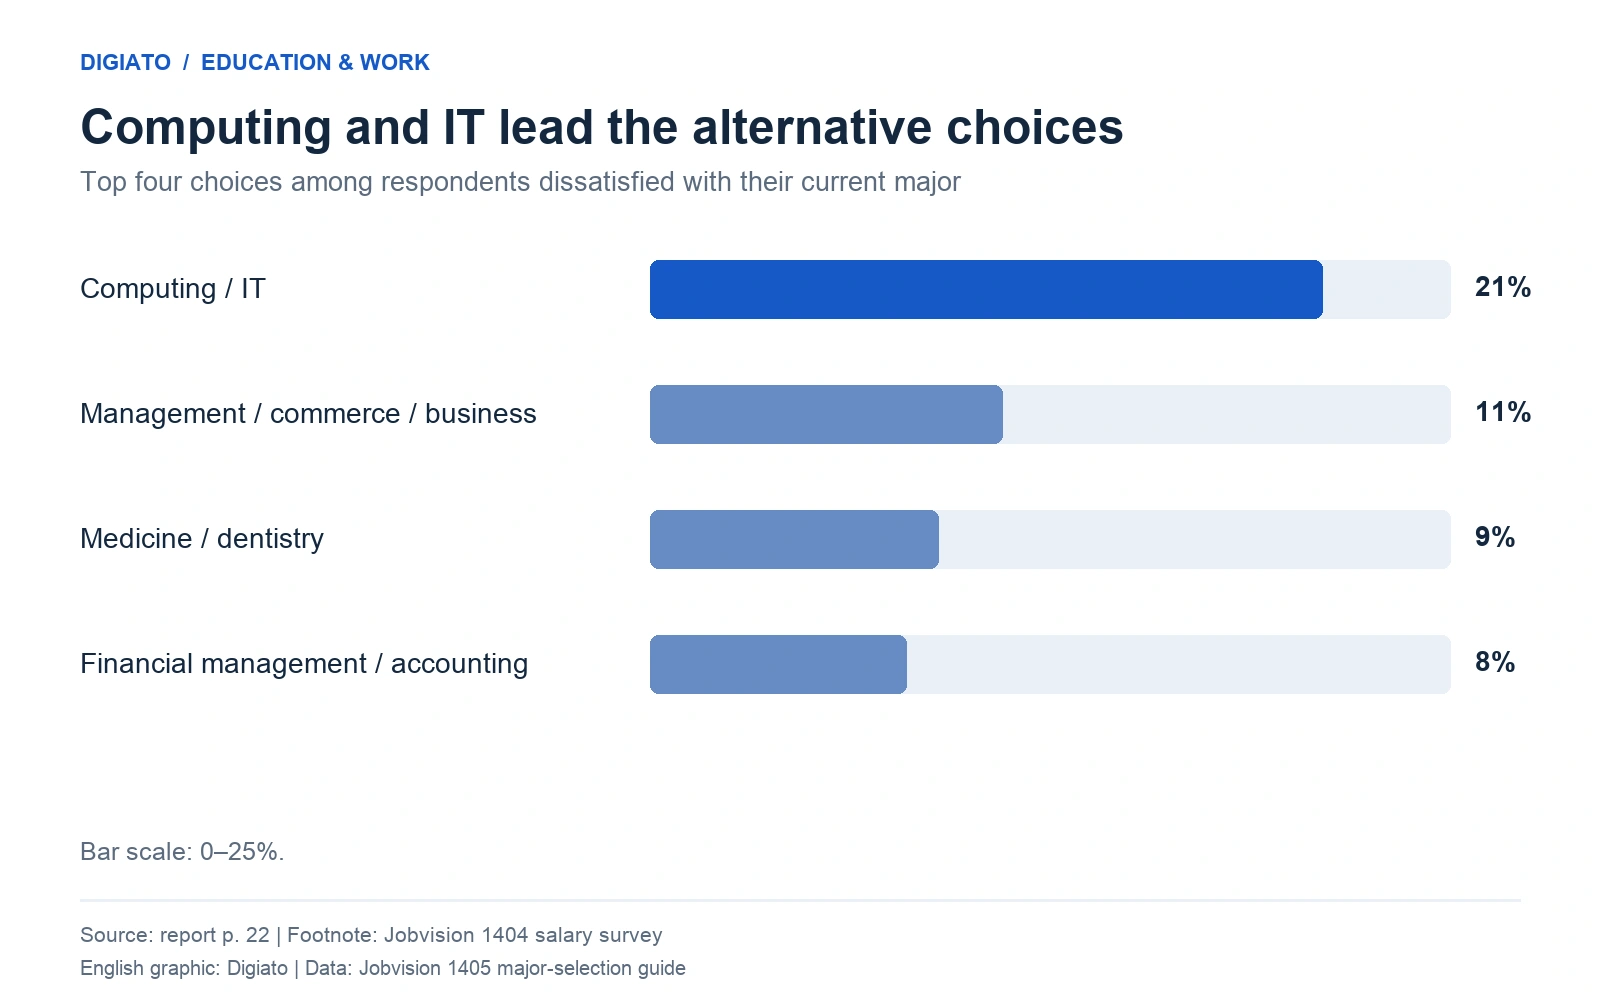
Some 21% of respondents unhappy with their major named computing or IT as their alternative choice, ahead of management, commerce and business at 11%, medicine and dentistry at 9%, and financial management and accounting at 8%.
The findings appear in Jobvision’s 1405 university-major selection guide, its 2026 edition. The report examines how graduates’ views of their education relate to the jobs they find and the income they earn. It draws on 2.4 million résumés, 100,000 survey responses and a review of 3,000 university admission codes identifying study options.
Read Jobvision’s full guide (Persian PDF).
Six in ten are unhappy with at least one educational choice
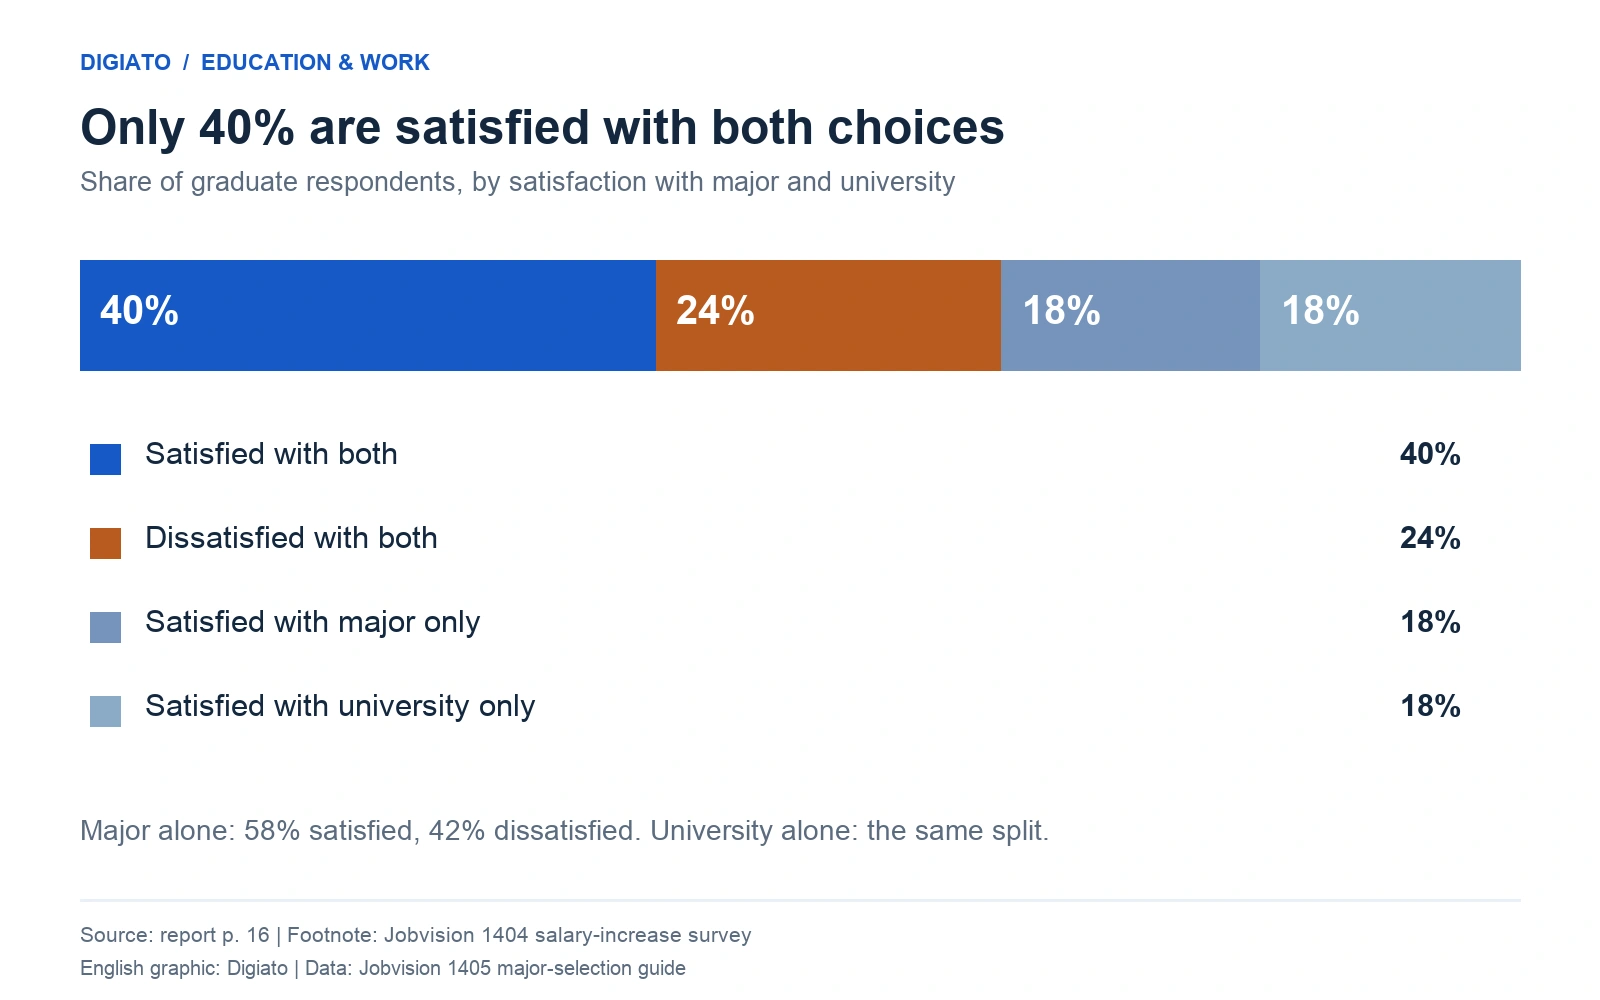
Only 40% of graduate respondents said they were satisfied with both their major and their university. The remaining 60% were dissatisfied with at least one: 24% were unhappy with both, 18% were satisfied with their major but not their university, and another 18% were satisfied with their university but not their major.
Taken separately, the two choices had identical results: 58% were satisfied with their major and 42% were dissatisfied; the same split applied to university satisfaction.
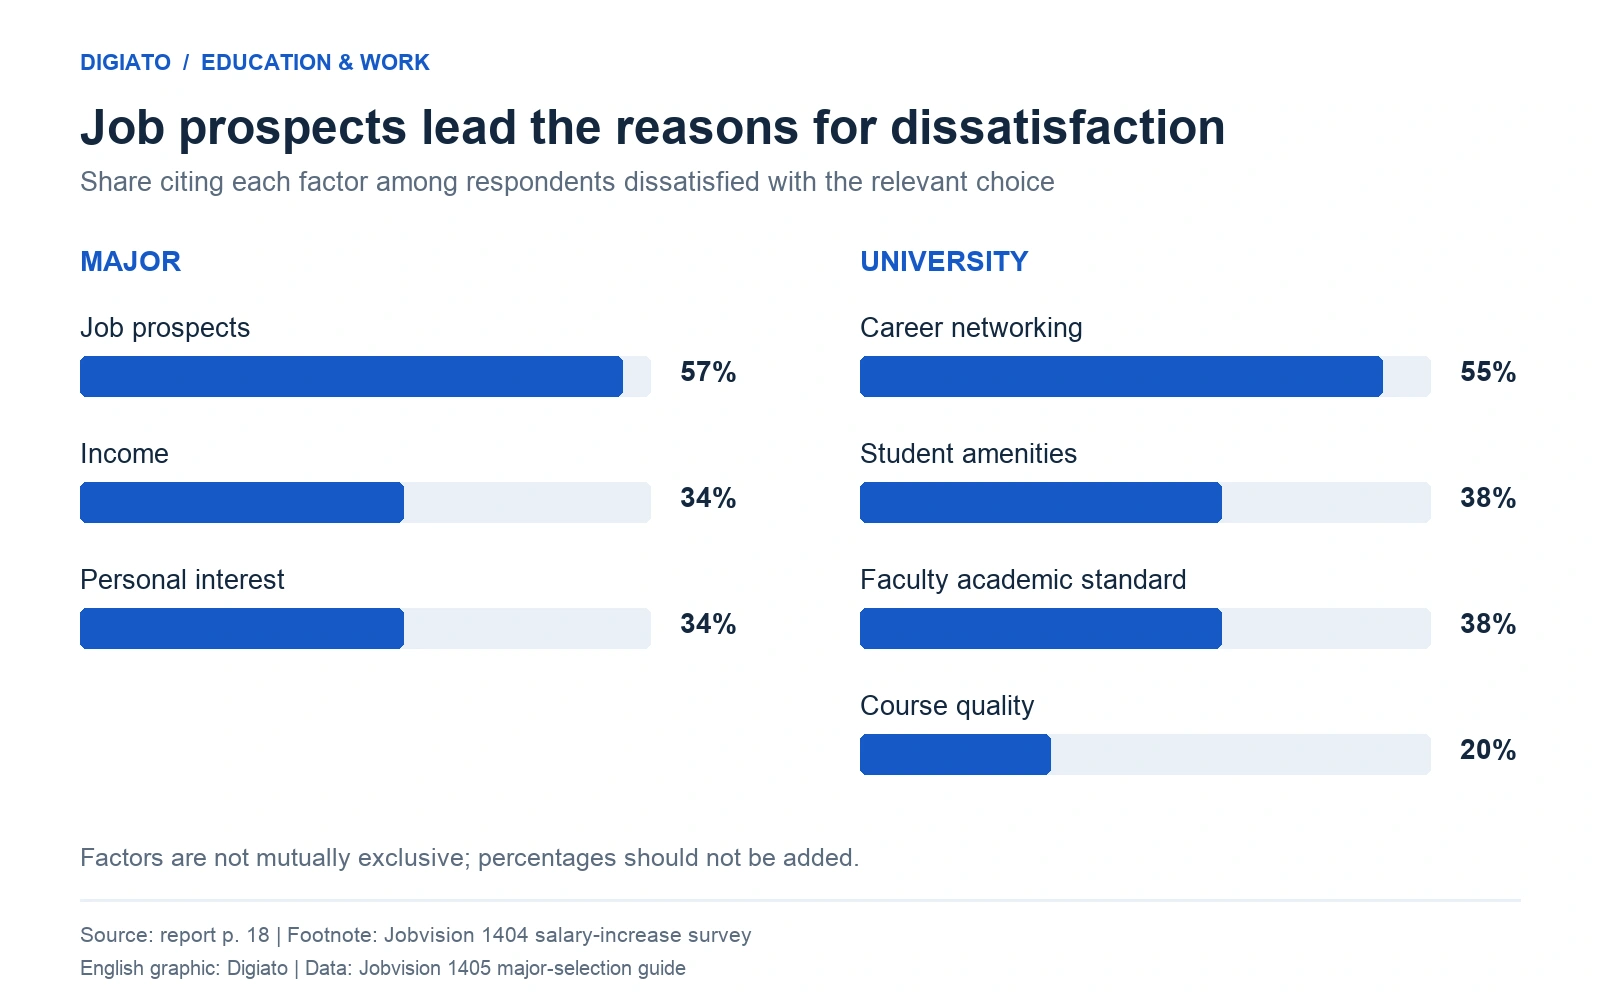
Job prospects were the most frequently cited reason for dissatisfaction with a major. Among respondents unhappy with their subject, 57% cited a poor job market, compared with 34% citing income and 34% citing personal interest.
For those dissatisfied with their university, 55% cited its weakness in helping them build professional networks for entering the job market and advancing their careers. Student amenities and the academic standard of faculty were each cited by 38%, while course quality was cited by 20%.
These factors could overlap; the percentages are not parts of a single total. Together, they point to the importance graduates attach to what happens after university, alongside their experience of studying.
Employment matters, but so does working in a related field
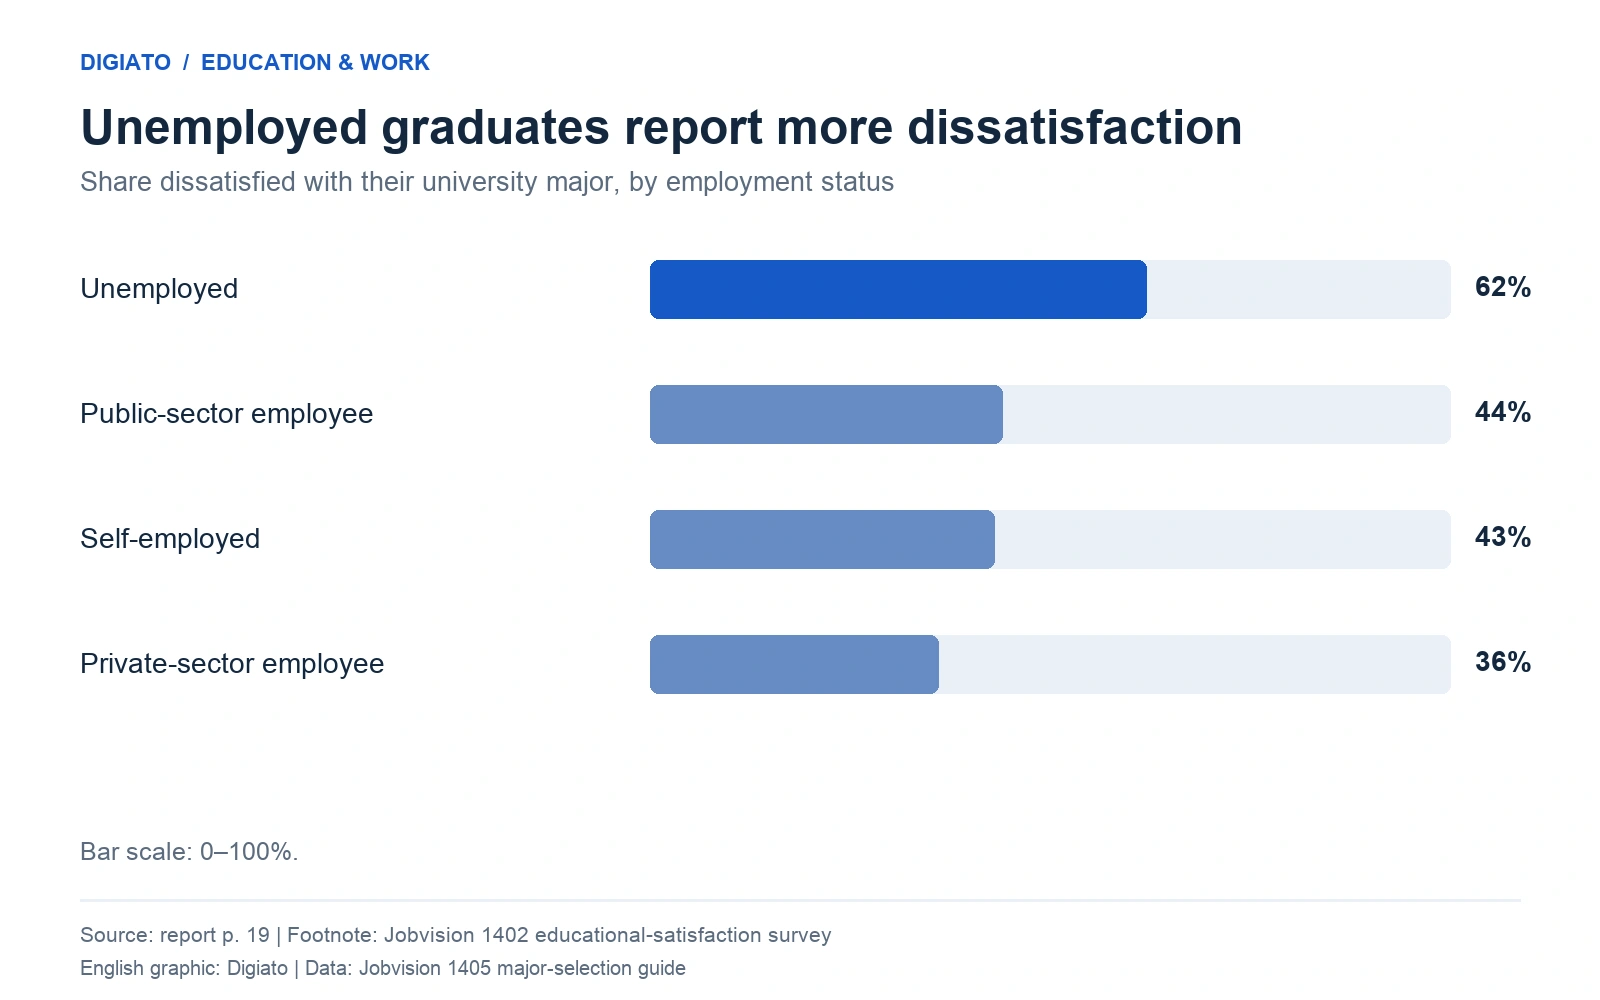
Dissatisfaction with a major was highest among unemployed graduates, at 62%. The figure was 44% among public-sector employees and 43% among self-employed respondents, falling to 36% among private-sector employees.
The gap between unemployed and private-sector respondents was 26 percentage points. The unemployed group’s dissatisfaction rate was approximately 1.7 times as high.
Having a job was only part of the picture. Jobvision reported that graduates working outside their field of study were 2.5 times as likely to be dissatisfied with their major as those working in a related field.
That association adds another dimension to choosing a degree: whether a subject offers a route into relevant work, as well as whether its graduates can find employment at all.
Higher earnings accompany greater satisfaction
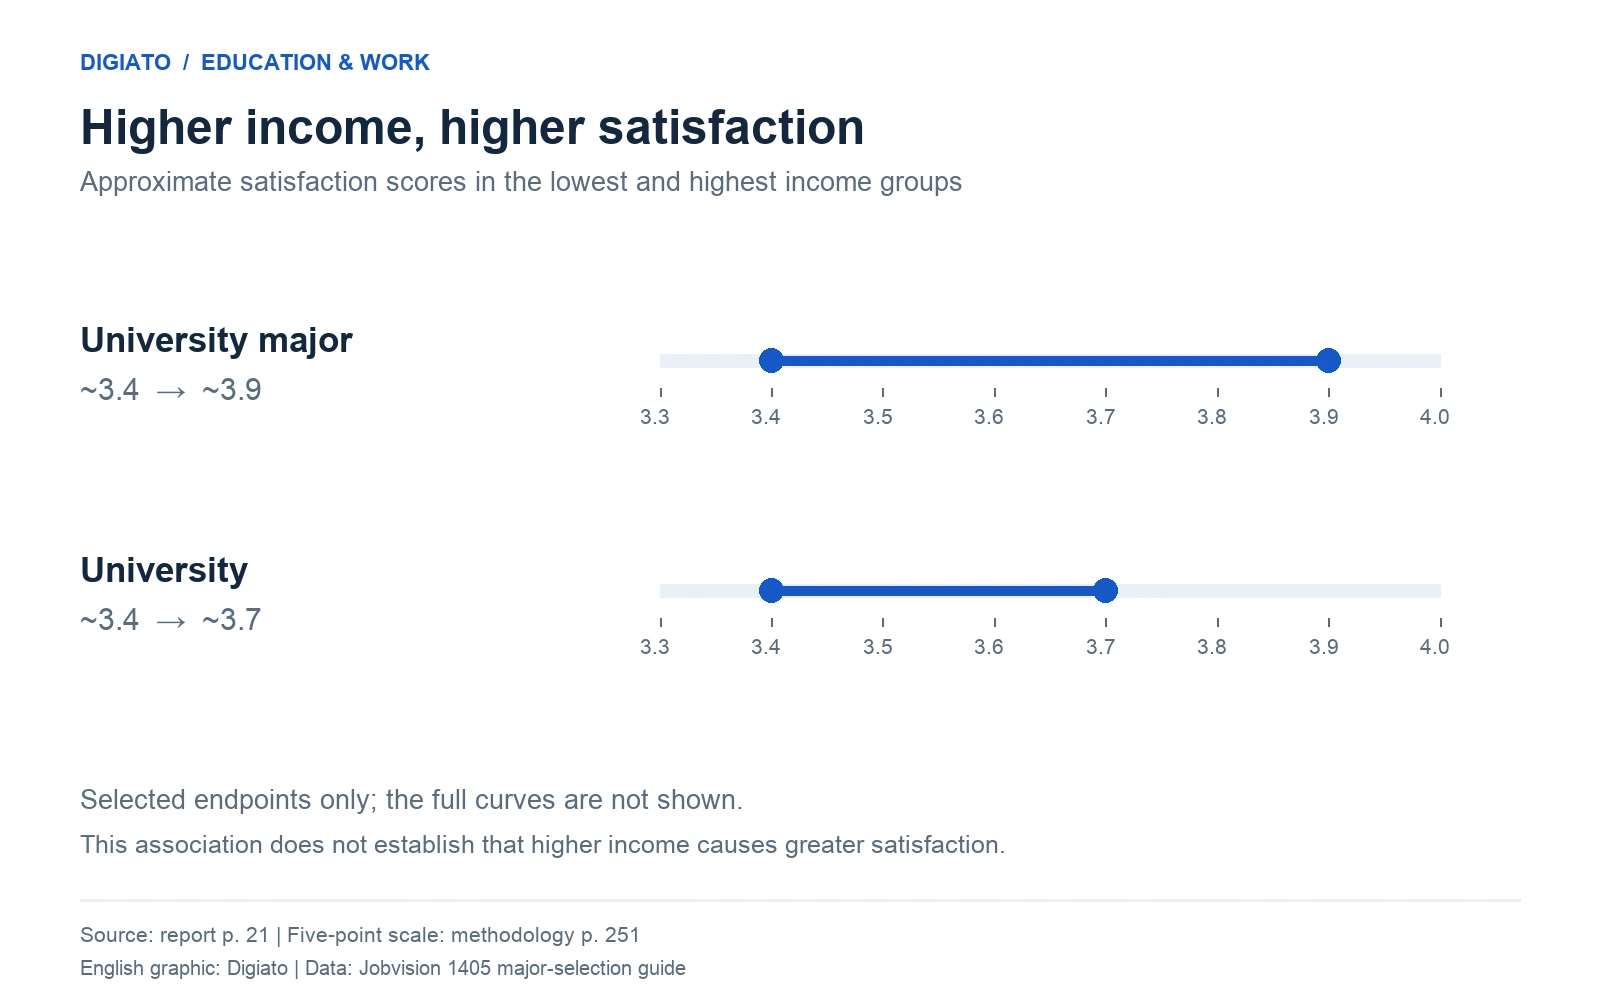
Respondents in higher monthly-income groups generally reported greater satisfaction with both their major and their university.
Average satisfaction with a major rose from roughly 3.4 in lower-income groups to nearly 3.9 in the highest group, on a five-point scale. Much of the increase occurred before the middle-income range, followed by a comparatively flat stretch and a further rise at the top.
University satisfaction followed a more gradual and uneven upward pattern, moving from around 3.4 to approximately 3.7. These are associations in the report’s data and do not establish that income itself causes greater satisfaction.
The preference for computing and IT among dissatisfied graduates fits the report’s broader finding that subjects seen as offering better employment and income prospects become more attractive when people reconsider their earlier choices.
A related degree is not the only route into many occupations
The report also shows that workers in several occupational groups often studied subjects outside their current field of work.
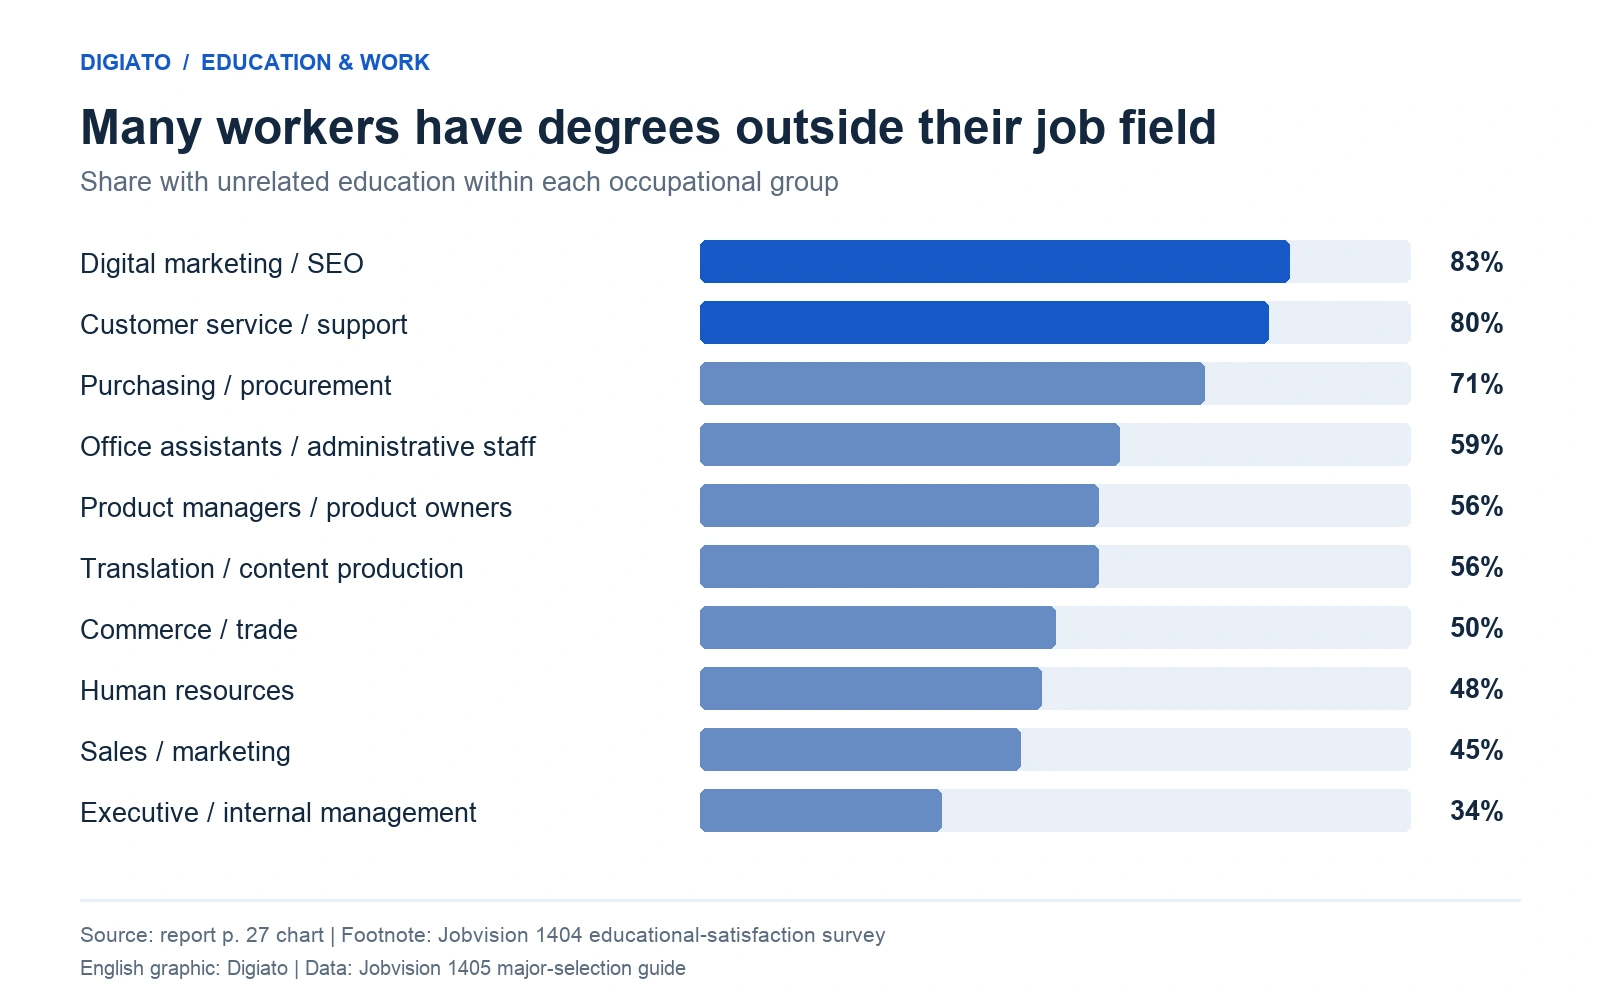
In the report’s occupational chart, 83% of digital-marketing and search-engine-optimization workers had unrelated education. The figure was 80% for customer service and support, 71% for purchasing and procurement, and 59% for office assistants and administrative staff.
For product managers and product owners, the share was 56%, the same as for translation and content production. It was 50% in commerce and trade, 48% in human resources, 45% in sales and marketing, and 34% in executive and internal management.
Jobvision suggests that some occupations lack a directly corresponding university subject, while students may also have limited knowledge of the educational routes into particular jobs. Workers can acquire relevant skills through training outside university and experience on the job.
For prospective students, the report’s findings put graduates’ actual career paths alongside the title of a degree when assessing study options. For universities, the importance respondents place on professional networks highlights their role in helping students move from education into work.