
Traffic from Iran seen by Cloudflare falls nearly 60% from weekly peak
Traffic from Iran observed by Cloudflare fell to 41% of its weekly peak, as users reported poorer service. The cause remains unclear.

Latest from Interview


Internet traffic from Iran observed by Cloudflare fell nearly 60% from its weekly high, as users reported worsening service and the cause of the decline remained unclear.
At 7 p.m. UTC on Oct. 25, the busiest point that day, traffic stood at 41% of the peak recorded on Oct. 19 in Cloudflare Radar's seven-day view. That puts the latest daily peak 59% below the week's highest level.
The figures describe traffic passing through Cloudflare's network, rather than all internet traffic in Iran. They compare individual peaks, rather than total data consumption across the week.
Cloudflare's four-week chart shows a longer decline. Traffic peaked on Sept. 30 and dropped sharply beginning Oct. 4. The Oct. 25 daily peak was just 32% of that four-week high, a decline of 68%.
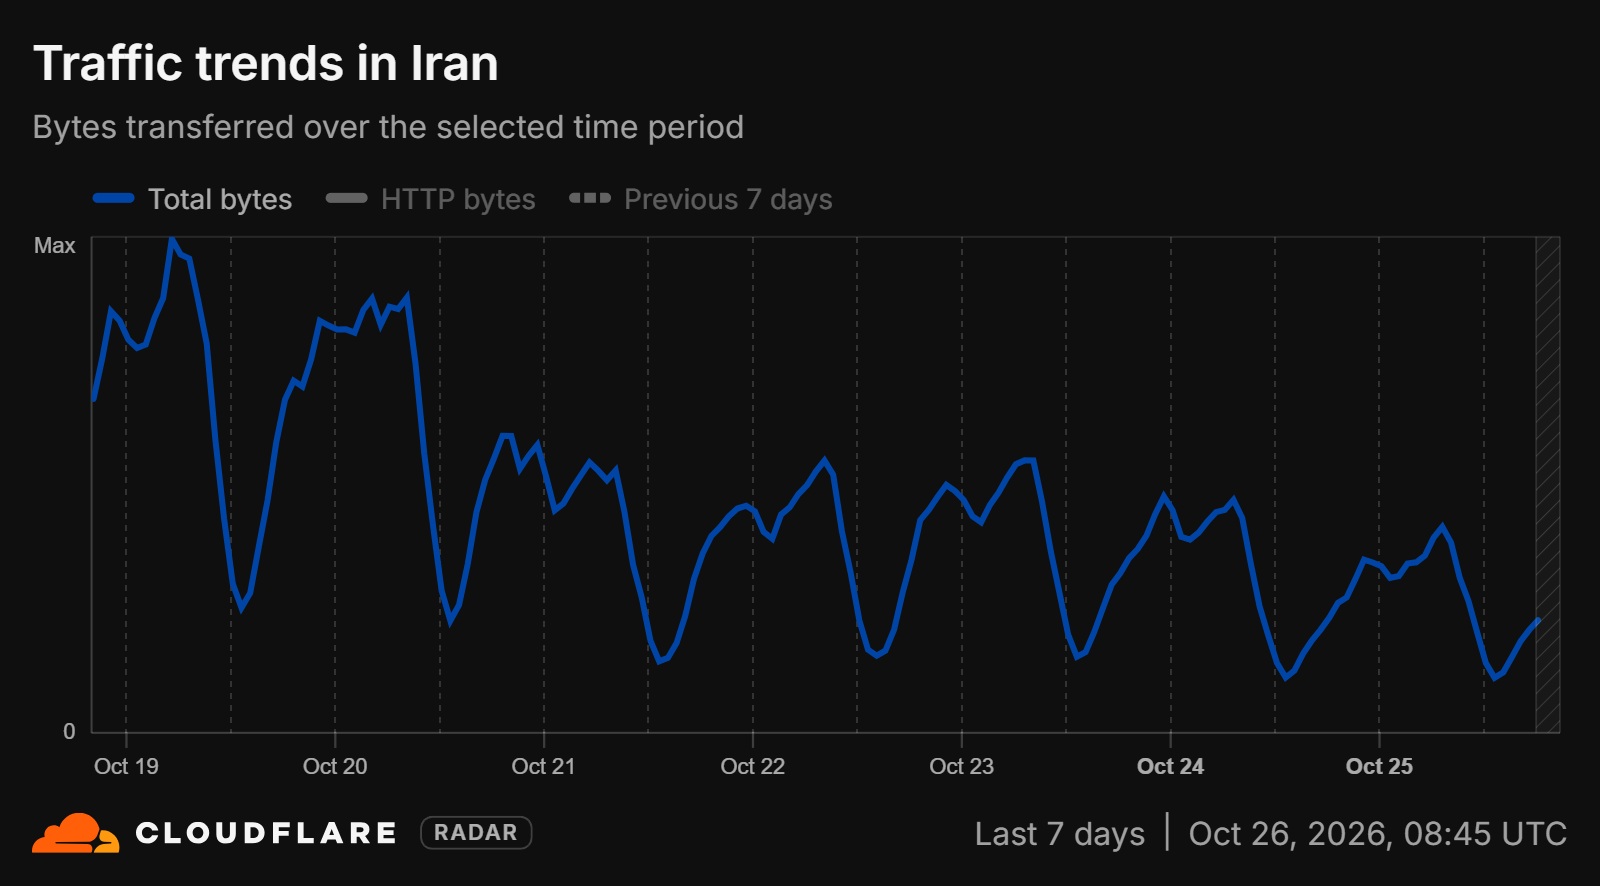
Users have reported poorer internet quality on social media in recent days. The reason for the traffic drop was not known at the time of the Oct. 26 report, and Iran's Ministry of Information and Communications Technology had not responded to it.
Cloudflare Radar can help identify changes in traffic patterns and possible disruptions. But its readings cover traffic visible to Cloudflare, and the percentages here are relative to the highest point in each selected period. They do not establish the scale of any decline in nationwide consumption or, on their own, explain what caused it.